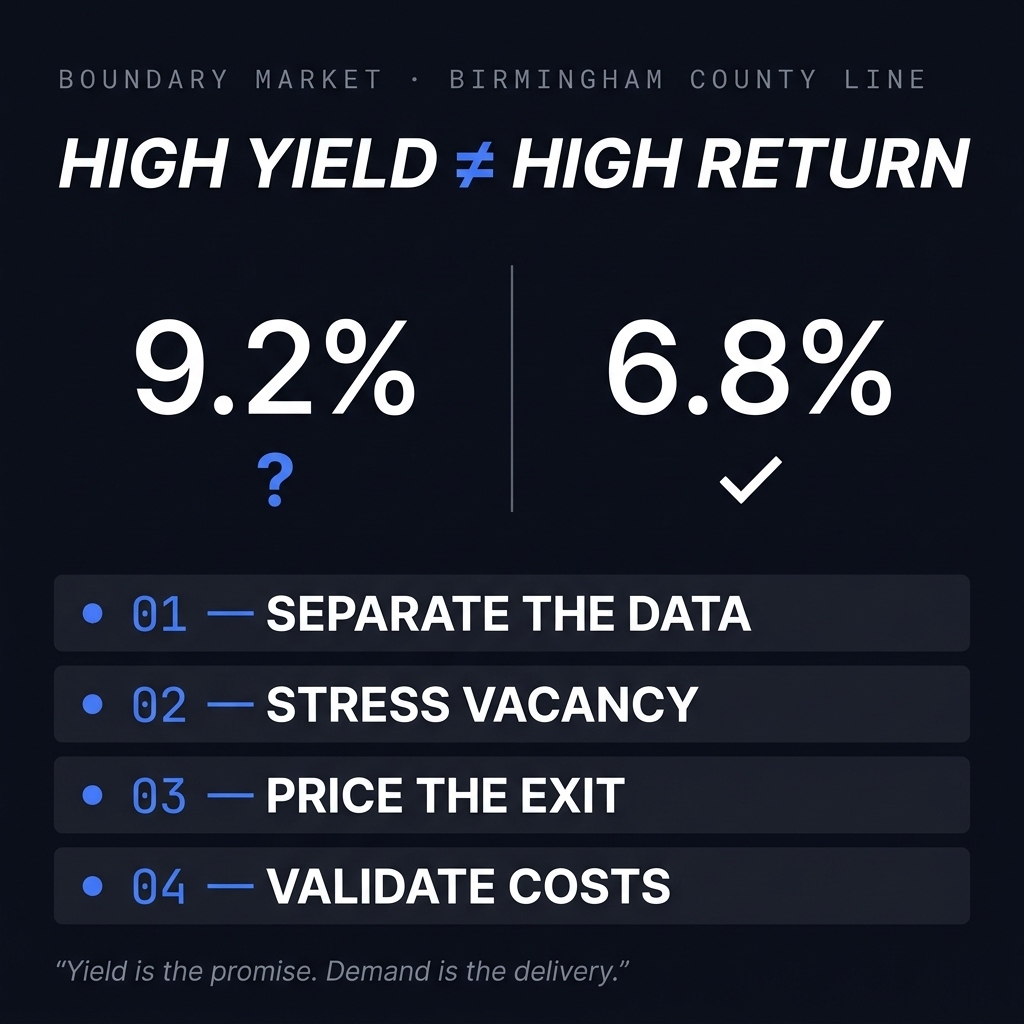
TL;DR: Tampa and Charlotte both look like strong Sunbelt plays on paper. They're not the same opportunity. Per Dynamic.RE data, Tampa's gross yield is 5.2% vs. Charlotte's 4.7%. Tampa looks like the higher-yield market. Net of Florida's insurance burden, it isn't. Tampa's 5.2% gross compresses to ~2.5 to 3% net. Charlotte's 4.7% gross holds closer to 4 to 4.5% net. The market that appears to offer more yield actually delivers less.
Tampa home prices fell 6% in 2025. Inventory is up 14.8%, and the market sits at 5.4 months of supply.
Tampa homeowners insurance averages $5,935/yr, roughly 2.8x the national average. That single line item flips the yield comparison.
Charlotte's gross yield is 4.7% per Dynamic.RE data, compared to Tampa's 5.2%. Tampa looks higher on paper. Net of insurance, it isn't.
Charlotte is an appreciation thesis with thin current cash flow. Tampa is a distressed-entry play for patient, conservative underwriters.
"Sunbelt" is a geography, not an investment thesis. Each metro now requires its own supply, demand, and expense analysis.
I spent the last several weeks pulling apart two markets investors keep asking me about: Tampa and Charlotte.
Both carried the same reputation. Fast growth, strong migration, attractive yields on paper. Both showed up on every "top Sunbelt markets" list from 2021 through 2024.
Here's what I found when I dug past the headlines.
The yield you see in the listing is rarely the yield you keep. In several Sunbelt metros, the gap between the pro forma number and the realized number has grown wide enough to turn a projected win into an actual loss. I call this the yield mirage. Tampa and Charlotte show two distinct versions of it.
Tampa: When the Growth Story Reverses on You
Tampa was the poster child of the pandemic migration boom. The pro formas circulating in 2022 assumed continued double-digit appreciation and steady rent growth.
The 2025 data tells a different story.
Tampa Bay home prices fell 6% in 2025, with analysts expecting further declines into at least Q1 2026. Inventory rose 14.8% year over year. The market now sits at 5.4 months of supply.
That supply number matters. It signals a buyer's market, putting downward pressure on both prices and rents.
Then there are the carrying costs nobody puts in the marketing deck.
The insurance line is where most pro formas quietly break down. Tampa investors pay roughly $5,935/yr on average for a standard single-family policy, compared to a national average of around $2,575. Florida homeowners overall pay approximately 2.8x the national average, driven by hurricane exposure, flood risk, and years of carrier exits that reduced market supply. On a typical SFR rental, that gap alone consumes a meaningful share of projected cash flow before accounting for maintenance, vacancy, or management.
The multifamily picture confirms the whiplash. Full-year 2025 deliveries fell 36.5% from 2024, and starts hit their lowest level since Q3 2019. Apartment rents softened after years of aggressive supply additions. Single-family rents are a different story: SFR rents in Tampa stayed up approximately 4% year over year. The softness is real but concentrated in the apartment segment.
What looked like a high-yield market in 2023 and 2024 was absorbing an oversupply wave. Investors who underwrote off trailing performance bought into the correction.
💡 Investor note: Backward-looking yield calculations are unreliable in supply-heavy markets. Underwrite Tampa on current rents, current insurance quotes, and flat or declining prices. Stress-test from there.
Bottom line on Tampa: Entry conditions are more favorable than they've been in years. But the carrying cost structure requires conservative underwriting. The gross yield number on a listing sheet is not your realized return.
Charlotte: When Momentum Outruns the Math
Charlotte presents the opposite failure mode. The fundamentals look genuinely strong, and that strength is precisely what compresses the yield.
Charlotte jumped 13 spots to #5 in CBRE's 2026 North America Investor Intentions Survey. Institutional capital is active. Job growth is durable. Median days on market sit around 50 days, rising from pandemic lows and consistent with a market that has rebalanced, not one running hot.
That rebalancing creates a different problem for cash flow investors.
Institutional demand at that scale compresses cap rates. When CBRE flags a market as a top-five target, capital allocators follow, and their buying power bids up acquisition prices faster than rents can catch up. The result shows up in the yield data: Dynamic.RE puts Charlotte's gross yield at 4.7%, placing it near the bottom of yield rankings alongside compressed metros like Phoenix, Denver, and Seattle. These figures are illustrative estimates based on current market data. Actual yields will vary based on financing, property condition, operating expenses, and execution.
Charlotte's rental market has been resetting after heavy apartment construction, with a large wave of new units slowing rent growth in the near term.
The honest framing: Charlotte is an appreciation thesis with thin current cash flow. That's a reasonable strategy for the right investor. It becomes a problem when the spreadsheet says "cash flow market" and the market says otherwise.
Bottom line on Charlotte: Strong fundamentals support long-term appreciation. Investors prioritizing immediate cash flow will find the numbers tight. Know which thesis you're underwriting before you commit.
The Number That Actually Matters: Net Yield After Insurance
Here's the comparison most Sunbelt analyses skip entirely. It's also the one that changes the decision.
Per Dynamic.RE data, Charlotte's gross yield sits at 4.7%, compared to Tampa's 5.2%. On paper, Tampa looks like the higher-yield market. Run the numbers net of insurance, and the comparison reverses.
Tampa's gross yield on a typical SFR sits around 5.2%, based on current rent levels and median acquisition prices. That sounds competitive until you subtract the insurance line. At roughly $5,935/yr for a standard policy, more than double what investors pay in most non-coastal markets, insurance alone strips out approximately 1.5 to 2 percentage points of net yield on a median-priced property. Add property taxes, maintenance reserves, and realistic vacancy in a 5.4-month-supply environment, and Tampa's realized net yield compresses toward 2.5 to 3% for a conservatively underwritten deal.
Charlotte's gross yield sits at 4.7% per Dynamic.RE data. Insurance on a standard homeowners policy in North Carolina averages around $1,600/yr — well below Tampa's $5,935 on a comparable policy basis. That smaller premium drag leaves significantly more of the gross yield intact. Net of realistic expenses, Charlotte holds closer to a 4 to 4.5% cap rate, meaningfully above Tampa's net figure, despite Tampa posting the higher gross number.
The yield mirage runs in the opposite direction from what most investors assume. Tampa's gross yield (5.2%) looks higher than Charlotte's (4.7%). Tampa's net yield, once Florida's insurance burden is priced in, falls well below it. The market most investors shorthand as the higher-yield play is, on a net basis, the lower-yield one.
Gross-to-gross comparisons between Florida markets and non-Florida markets aren't meaningful. The carrying cost structure is too different. Net yield is the only number worth comparing.
Estimated net yield ranges above are hypothetical illustrations based on current market data and stated assumptions. Actual results will vary based on financing terms, property condition, specific location, operating expenses, and execution. These figures should not be construed as a guarantee or projection of investment returns.
The core insight: Two markets with identical gross yields can produce materially different net returns when one sits inside Florida's insurance environment and the other doesn't. Always run the net number.
Why "Sunbelt" Stopped Being a Strategy
The most important finding from this analysis applies beyond these two cities.
The Sunbelt has fractured. As of early 2026, the region has split into distinct sub-markets with materially different supply dynamics, demand trajectories, and capital conditions. Analysts now draw a line between metros with resilient labor demand, like Charlotte, Nashville, and Raleigh-Durham, and metros facing sector concentration risk, like Austin and Houston.
Two forces drove the fracture:
Migration normalized. The pandemic-era demand wave settled to sustainable but structurally lower levels. That removes the tailwind most 2021-era pro formas quietly assumed would continue.
Overbuilding caught up. Realtor.com projected 22 of the 100 largest U.S. metros would see home price declines in 2026, with the steepest drops concentrated in the Sunbelt and Western states. The two hardest-hit Florida metros: Cape Coral-Fort Myers, forecast down 10.2%, and North Port-Sarasota-Bradenton, forecast down 8.9%.
Projected appreciation turning into actual depreciation is the mechanism that breaks total returns. The gross yield looks fine while equity erodes underneath it.
"Sunbelt" is a geography. Each metro inside it now requires its own supply analysis, its own demand analysis, and its own expense assumptions.
Where this leaves investors: Metro-level selection now matters more than regional allocation. The Sunbelt label no longer does the analytical work it once did.
How to Underwrite Through the Mirage
Here's the framework I apply to any high-growth market, whether it's Tampa, Charlotte, or the next metro on a top-ten list.
1. Separate gross yield from net yield
Gross yield ignores the line items that vary most by market. In Florida, insurance is the yield killer, and as the Tampa-Charlotte comparison shows, it can flip which market wins on a net basis. In fast-appreciating metros, property taxes reset upward. Run the net number with local insurance quotes, current tax assessments, and realistic vacancy before comparing any two markets.
2. Check the supply pipeline before trusting rent assumptions
Tampa's rent softness and Charlotte's rent reset both trace back to construction pipelines that were visible in the data years earlier. Deliveries scheduled for the next 24 months tell you more about future rents than the last 12 months of rent growth.
3. Name your actual return source
Every deal earns its return from cash flow, appreciation, or debt paydown in some mix. Charlotte at a 4.7% gross yield is an appreciation and job-growth play. Tampa right now is a distressed-entry play for patient investors who can absorb near-term price softness. Label the thesis honestly and size the margin of safety to match.
4. Underwrite demand at today's level, not 2021's
Migration has normalized. Assume current absorption, current in-migration, and current employer commitments. If the deal only works at 2021 demand levels, it doesn't work.
The Investor Takeaway
Neither market is broken. Both are mispriced relative to their headlines.
Tampa suits patient buy-and-hold investors who underwrite conservatively, negotiate hard in a 5.4-month-supply environment, and price in the full insurance burden. The entry discount is real. So is the near-term downside, and so is a carrying cost structure that, on a net basis, compresses yield below what the gross number implies.
Charlotte suits investors prioritizing long-term appreciation and durable job demand who accept thin initial cash flow. The fundamentals justify institutional interest. The yields don't justify a cash flow thesis at current prices.
The number that attracts you to a market is rarely the number that determines your outcome.
Key Takeaways
Per Dynamic.RE data, Tampa's gross yield is 5.2% vs. Charlotte's 4.7%. Tampa looks higher. Net of Florida's insurance costs, Tampa compresses to ~2.5 to 3%; Charlotte holds at ~4 to 4.5%. The apparent yield leader is the net yield laggard.
Tampa homeowners insurance averages $5,935/yr, roughly 2.8x the national average. That's the number most pro formas miss.
SFR rents in Tampa are still up ~4% YoY. The softness is concentrated in the multifamily segment, not single-family.
Charlotte is an appreciation play, not a cash flow play. Institutional demand (CBRE #5) compresses cap rates. Dynamic.RE puts Charlotte's gross yield at 4.7%, which leaves limited room for cash flow investors.
The Sunbelt has fractured. Metro-level supply, demand, and expense analysis is now required. Regional labels aren't enough.
Cape Coral-Fort Myers (-10.2%) and North Port-Sarasota-Bradenton (-8.9%) face the steepest projected price declines in Florida in 2026, per Realtor.com.
Always compare net yield, not gross yield, when evaluating markets with different insurance, tax, and expense structures.
Run the Numbers Yourself
Gross yields attract capital. Net yields, after insurance, taxes, and vacancy, build wealth. Before committing to Tampa, Charlotte, or any Sunbelt metro, run the property through current rents, current expenses, and current supply data. The market that looks better on a listing sheet may look worse on a signed lease.
Run your own property analysis with Dynamic.RE and turn market noise into investment clarity.
Frequently Asked Questions
Is Tampa a good place to invest in real estate in 2026?
Tampa offers a distressed-entry opportunity for patient, conservative investors. Home prices fell 6% in 2025, inventory is elevated at 5.4 months of supply, and insurance costs are significantly above the national average. Investors who underwrite at current rents, current insurance quotes, and flat prices find viable deals. Those relying on trailing performance or gross yield alone are likely to be disappointed.
Is Charlotte a good place to invest in real estate in 2026?
Charlotte is a strong long-term appreciation market. CBRE ranked it #5 in its 2026 Investor Intentions Survey. The fundamentals, including job growth and migration, are durable. Dynamic.RE puts Charlotte's gross yield at 4.7%, which leaves limited room for a cash flow thesis at current prices. Charlotte suits investors with an appreciation-first strategy who can tolerate thin near-term cash flow.
Why does Tampa have a lower net yield than Charlotte despite similar gross yields?
Florida's insurance environment is the key variable. Tampa homeowners pay roughly $5,935/yr on average for a standard single-family policy, compared to a national average of $2,575 and approximately $1,600/yr in North Carolina on a comparable basis. That gap strips out approximately 1.5 to 2 percentage points of net yield on a median-priced Tampa property. Charlotte's smaller insurance burden means more of its 4.7% gross yield survives to net, pushing its realized cap rate above Tampa's despite Tampa posting the higher gross number.
What is the "yield mirage" in Sunbelt real estate?
The yield mirage is the gap between the gross yield shown in a listing or pro forma and the net yield an investor actually realizes after accounting for local operating costs, including insurance, property taxes, vacancy, and maintenance. In Florida markets like Tampa, that gap is large enough to materially change the investment thesis.
Are Sunbelt real estate markets still worth investing in?
The Sunbelt has split into distinct sub-markets with materially different conditions. Metros with resilient labor demand, such as Charlotte, Nashville, and Raleigh-Durham, continue to attract institutional capital and support long-term appreciation. Metros with oversupply and insurance risk require a more cautious, deal-specific approach. "Sunbelt exposure" alone is no longer a sufficient investment thesis.
Which Florida markets face the steepest price declines in 2026?
Realtor.com projected that Cape Coral-Fort Myers would see home prices decline approximately 10.2% in 2026, and North Port-Sarasota-Bradenton would decline approximately 8.9%. Both are driven by overbuilding, elevated insurance costs, and post-hurricane inventory increases.
What is single-family rent growth in Tampa in 2025?
Single-family rents in Tampa remained up approximately 4% year over year in 2025. The rent softness widely reported in Tampa is concentrated in the multifamily and apartment segment. Investors underwriting SFR rentals should separate the two segments when building rent assumptions.
How should investors underwrite a Sunbelt market in 2026?
Start by separating gross yield from net yield using local insurance quotes, current tax assessments, and realistic vacancy. Check the construction pipeline for the next 24 months before anchoring rent assumptions to trailing growth. Name the return source explicitly: cash flow, appreciation, or debt paydown. Underwrite demand at today's absorption levels, not 2021 levels.
This content is for informational and educational purposes only and should not be construed as investment, legal, tax, or financial advice. Figures shown are illustrative estimates based on historical market data and assumptions that may not reflect actual results. Real estate investments involve risk, including possible loss of principal. Past performance does not guarantee future results. Investors should conduct their own due diligence and consult qualified advisors before making investment decisions.
.png)