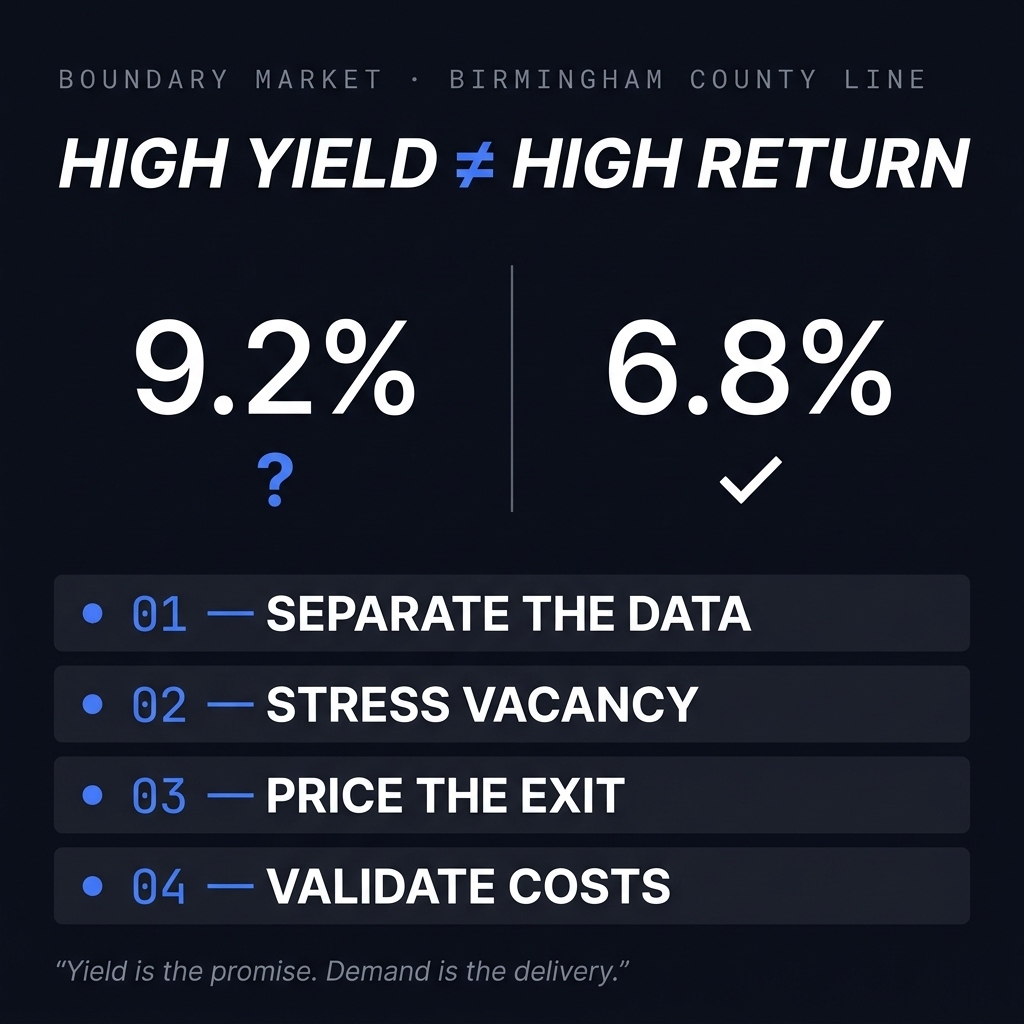
TL;DR: Columbus is a long-cycle appreciation play with strong demographic fundamentals. Cleveland is a cash flow market with higher operational complexity. The spread between them runs about 3.2 percentage points of gross yield. Which side of that trade fits your strategy determines which city belongs in your next underwriting model.
Columbus gross yield: ~6.5% vs. Cleveland: ~9.7% on comparable 3BR rentals
Cleveland produces ~$0.80 rent per $100 of price; Columbus produces ~$0.54
Intel's Ohio fab is a real catalyst, but production is delayed to 2030-2031, not imminent
Columbus growth rests on three legs: job creation, family formation, and international migration
Cleveland's migration picture is more balanced than headline numbers suggest: 8,876 immigrants arrived while 6,741 left, leaving a net gain of roughly 2,000
I spent a few weeks pulling apart the data on Ohio's two largest metro stories. One question kept coming back: how much should an investor pay for growth, and when does a shrinking market become a better deal than a booming one?
Columbus and Cleveland sit 140 miles apart. Their investment profiles sit much further apart than that. Here's what the numbers actually show.
The Headline Numbers: Where Do These Markets Actually Stand?
Start with population. In single-family real estate, prices follow people.
The Columbus metro grew by more than 21,000 people in the past year, reaching 2.24 million residents in 2025. That growth rate runs at double the national average, tying Columbus with Atlanta for the 15th fastest growth rate among large metros. Among the top 15, only Columbus, Seattle, and Indianapolis sit outside the Sun Belt.
Columbus is the only Midwestern city in the top 25 for net new population growth between 2024 and 2025, adding 7,700 residents to pass 938,000 in the city proper.
Cleveland's data reads differently. According to U.S. Census Bureau estimates, Cleveland's 2024 city population sits at approximately 366,000, continuing a decline of about 1.7% since the 2020 census, roughly 0.4% annually. Median household income is $40,801. The poverty rate is 28.3%.
Multiple economic rankings place Cleveland near the bottom of large U.S. metros for economic performance. The Greater Cleveland Partnership, the region's primary economic development organization, has identified population loss as its central challenge, describing it as the region's biggest issue in public statements.
When a region's own economic leadership names population loss as the core problem, that's a material input to your investment thesis, not a footnote.
Bottom line: Columbus is growing faster than nearly every non-Sun Belt city in the country. Cleveland is stabilizing at best.
Why Columbus Keeps Compounding: The Three Drivers
Population growth alone is a lagging indicator. The drivers are what tell you whether the trend holds.
Three forces stood out in my research.
1. The Intel Effect
Intel's $28 billion semiconductor investment in Licking County, just east of Columbus, is projected to create 3,000 long-term Intel jobs and 7,000 construction jobs, with tens of thousands more in supplier and ancillary roles. It's the largest private-sector commitment in Ohio history.
Investors should underwrite the timeline carefully. Intel originally targeted production at the first fab for 2025, then pushed that to 2027. The current confirmed schedule: construction of Mod 1 completes in 2030, with operations beginning between 2030 and 2031. The second fab follows in 2031-2032. Permanent manufacturing jobs arrive four to five years later than early forecasts implied. Intel has said it could accelerate if customer demand warrants, but the base case is a long-cycle catalyst.
Early forecasts of central Ohio housing prices rising 5 to 10 percent or more were written before the delay was confirmed. That upside may still arrive, but over a longer horizon and subject to execution. Treat Intel as structural margin of safety, not a near-term demand driver.
Institutional capital has taken note. Industrial and multifamily investors now treat Columbus as a primary market. Regional forecasters project the metro to approach 3 million residents by mid-century, though long-range population projections carry wide confidence intervals and should be treated as directional, not precise.
Investor implication: Intel is real, but it's a decade-long thesis. Don't underwrite it as a 2025 or 2026 event.
2. Demographic Depth
This is the part that often gets overlooked. Growth built on migration alone can reverse. Growth built on families forming tends to persist.
In Columbus, 35% of metro growth came from natural growth, meaning net births over deaths, versus a national rate of 30%. Columbus ranks 16th among large U.S. metros for births per 1,000 residents. Young people are choosing to build families there, not just move through.
Columbus also captured 38% of Ohio's net international migration in 2025. Ohio posted positive net domestic migration that year, among the first positive readings for a major Midwest state this decade, according to U.S. Census Bureau estimates.
Investor implication: Organic population growth is a more durable demand signal than in-migration alone. Columbus has both.
3. A Long Track Record, Not a Spike
Over the past decade, Columbus moved from 26th to 15th in population growth rate among the nation's largest metros. Site Selection magazine has named the region a top 10 metro per capita for economic development for 14 consecutive years. In 2025 alone, One Columbus announced 39 projects representing 7,000 jobs and $5 billion in capital investment. Forty-two percent of that capital came from foreign-owned companies.
Unemployment in Columbus sits below the national average, consistent with a labor market that has absorbed significant job creation without triggering wage-driven inflation in the rental market. The Columbus metro has not recorded a meaningful population decline at the metro level in recent decades, a distinction that matters for long-term asset pricing.
Key Point: Columbus growth rests on three separate legs: job creation, family formation, and international migration. A market needs only one of those legs to break for growth to stall. Columbus has redundancy across all three.
The Cleveland Case: What the Data Actually Shows
Balanced analysis matters more than a clean narrative. Cleveland's story is more nuanced than the headline decline numbers suggest.
Cleveland's metro population edged up slightly for the second straight year, even though the metro remains down for the decade. Cuyahoga County's population fell 1.7% this decade, driven partly by deaths outpacing births. On the migration side, 6,741 residents moved out to other states or Ohio counties, while 8,876 immigrants arrived. The county posted a net migration gain of roughly 2,000 people. Outmigration is real. It's not the complete picture.
The poverty picture remains difficult. Cleveland carries the second highest poverty rate among large U.S. cities at 28.3%, behind only Detroit.
For an investor, this translates into four specific implications:
Entry prices run low, which can support strong gross yields on paper.
Rent growth depends on demand, and demand depends on population and income trends. The cited Cleveland Magazine data shows recent income gains in the city, but population-level demand at the metro remains under pressure.
Tenant income fragility raises collection risk and turnover costs, which erode paper yields in practice.
Exit liquidity in a declining market can be thin exactly when you need it.
Cash flow investors can find workable deals in Cleveland. The work sits in neighborhood selection, tenant screening, and conservative rent assumptions. Citywide averages hide significant block-by-block variation. Treat metro-level data as a starting point for due diligence, not a verdict on any specific property.
Key Point: Cleveland isn't uninvestable. It requires a different skill set, a tighter operating model, and more conservative assumptions than Columbus.
What Does Academic Research Say About Paying for Growth?
This is where the investigation got interesting.
Research on firm location and asset pricing found that the value-growth premium for publicly-traded companies headquartered in high-appreciation markets runs 3.6% per year larger than in low-appreciation markets. Worth noting: the paper measures equity returns for firms by headquarters location, not returns to buying houses directly. It doesn't translate as a precise SFR underwriting input. What it does tell us, directionally, is that high appreciation markets embed that expectation into asset prices. That mechanism tends to compress future returns on growth-oriented assets relative to value-oriented ones.
In plain English: strong past appreciation gets priced in. When you buy into a market after a long run of price growth, part of the future upside already sits in your purchase price.
Applied to this comparison, the research cuts both ways.
Columbus: Buyers today pay for growth the market already expects. If Intel delivers and population trends hold, the thesis works. If timelines slip or supply catches up, the entry price absorbed upside that never arrives.
Cleveland: Buyers pay little for expected growth, because the market expects little. Any stabilization or modest improvement flows more directly to the owner. The risk sits in the base case: continued decline erodes rents, values, and liquidity over your hold period.
Key Point: Appreciation expectations are already embedded in Columbus entry prices. In Cleveland, you're not paying for a recovery thesis. That's both the opportunity and the risk.
What the Numbers Show at the Property Level
The growth premium needs to be measured, not just asserted. Here's what a direct comparison at the rental property level looks like.
Cleveland's gross yield on a 3-bedroom rental runs at approximately 9.7%, versus 6.5% for a comparable property in Columbus. On a rent-per-$100-of-price basis, Cleveland produces roughly $0.80 against Columbus at $0.54. That $0.26 spread is the cash flow cost of buying the growth premium today.
Methodology note: Yield figures are illustrative estimates derived from county-level HUD Fair Market Rents divided by median listing prices. These are gross yields before vacancy, maintenance, management, taxes, and financing costs. They represent metro- and county-wide averages, not property-level observations, and actual results will vary materially based on specific property, location, condition, and operating assumptions. See the full performance disclaimer below.
A ZIP-level comparison is where this gets counterintuitive. In ZIP 44111 (west Cleveland), the measured demand score is 59.8, price-cut rate is 11.2%, and the data flags no risk indicators. In ZIP 43232 (east Columbus), the demand score is 50.0, list prices are down 14.6% year-over-year, and the data flags both declining prices and weak demand.
On entry yield, 44111 beats 43232 by a meaningful margin. On measured demand, 44111 also leads. The Columbus metro story is real and durable at the city level. But within the best rental ZIP comparison available, Cleveland's west side outperforms Columbus's east side on both yield and current demand signals. That's the counterintuitive finding that most market comparisons miss entirely.
The listing-side data adds useful texture here. Columbus shows list prices down 5.2% with 27.9% of active listings taking price cuts. Cleveland shows list prices down 1.1% with 16.5% taking price cuts. The important caveat: Columbus sold prices are still up 7.5% year-over-year. Listing price adjustments reflect seller behavior in response to affordability pressure, not necessarily softening transaction values. Both data points belong in the picture.
Neither yield number is better in isolation. The question is which spread your strategy requires. A cash-flow-first investor who underwrites Cleveland's turnover costs, maintenance budget, and vacancy assumptions carefully can still build a return above what Columbus offers on entry. An appreciation investor in Columbus accepts the compressed initial yield in exchange for a long-cycle demand story that, if it plays out, compounds differently.
Key Point: The growth premium between these two markets is approximately 3.2 percentage points of gross yield. You're paying for it at entry in Columbus, or accepting the operational complexity of a high-yield market in Cleveland. Both are real costs. Both belong in your model.
How to Underwrite Each Market
Columbus fits investors prioritizing appreciation potential and long-hold compounding. Buy-and-hold in the growth corridors, especially near the Licking County employment expansion, aligns with the demand drivers. Underwrite with today's rents, and treat any Intel-driven upside as margin of safety, not base case.
Cleveland fits experienced cash flow investors with strong local operations. The market rewards operators who screen tenants carefully, manage intensively, and buy in stable sub-markets. Underwrite flat to declining rents, budget for higher turnover, and require a purchase price that works without any appreciation.
One Cleveland-specific risk that doesn't appear in yield calculations: the Cuyahoga Metropolitan Housing Authority (CMHA) administers roughly 16,000 Section 8 housing vouchers and, as of mid-2025, was facing a significant voucher budget shortfall, asking landlords not to raise rents while seeking additional federal funding. Separately, source-of-income discrimination, meaning landlords refusing to rent to voucher holders, is legal in the city of Cleveland. A 2021 proposal for city-level protections never passed. These two facts together mean a segment of the tenant pool that supports Cleveland's rental demand faces structural friction that doesn't resolve in a favorable direction regardless of gross yield. Budget for this when underwriting at the property level.
Risks to watch in both markets: Columbus faces affordability pressure and the execution risk of a single anchor project shaping expectations. Cleveland faces demographic headwinds, income fragility, and thin exit liquidity in weaker sub-markets. Neither risk set disqualifies a market. Both belong in your underwriting model.
Key Takeaways
The growth premium between Columbus and Cleveland is real, measurable, and already reflected in entry prices
Columbus gross yield (~6.5%) vs. Cleveland (~9.7%): the 3.2-point spread is the cash flow cost of buying into a growth market
Intel is a structural long-term catalyst for Columbus, but production is confirmed delayed to 2030-2031. Underwrite accordingly
Columbus growth rests on three durable legs: job creation, family formation, and international migration
Cleveland's migration picture is more balanced than it looks: the county posted a net gain of ~2,000 people in the most recent data
Columbus suits appreciation-focused, patient capital. Cleveland suits operations-heavy, yield-focused investors with conservative assumptions
Either way, the decision belongs in a spreadsheet, at the property level, with your assumptions stated and your downside modeled
Frequently Asked Questions
Is Columbus or Cleveland better for real estate investing?
It depends on your strategy. Columbus suits appreciation-focused investors willing to accept lower initial yields in exchange for long-term demand growth. Cleveland suits cash flow investors who can manage higher operational complexity and underwrite conservatively.
What is the gross yield difference between Columbus and Cleveland?
Cleveland produces approximately 9.7% gross yield on a 3BR rental versus about 6.5% in Columbus, a spread of roughly 3.2 percentage points. On a rent-per-$100-of-price basis, Cleveland runs $0.80 versus Columbus at $0.54.
Is the Intel investment a good reason to buy in Columbus now?
Intel represents real long-term structural demand, but the production timeline has been pushed to 2030-2031. It's worth including in your thesis as margin of safety, not as a near-term catalyst that will move prices in the next 12 to 24 months.
What are the biggest risks in Cleveland's rental market?
The main risks are thin exit liquidity in weaker sub-markets, rent growth uncertainty in a low-demand environment, and the operational overhead of managing in a high-poverty market. Neighborhood selection and conservative vacancy and turnover assumptions are critical. The cited Cleveland Magazine data does show recent income gains in the city, so painting all of Cleveland with a single income-decline brush overstates the risk.
Why is Columbus growing so fast compared to other Midwest cities?
Columbus benefits from above-average natural population growth (35% of growth from net births vs. 30% nationally), strong international migration inflows, and sustained institutional investment. It's the only Midwestern city in the top 25 nationally for net population growth in 2024-2025.
What does the PSU research on the value-growth premium mean for investors?
The Penn State research found that publicly-traded firms headquartered in high-appreciation markets carry a value-growth premium of 3.6% per year compared to firms in low-appreciation markets. The paper measures equity returns by firm headquarters location, not returns to buying houses. It doesn't translate directly as an SFR underwriting input. The directional signal is that markets with strong historical appreciation embed that expectation into asset prices, which compresses future returns for buyers entering after a long run-up.
How should I underwrite Cleveland rental properties?
Use flat to declining rent assumptions. Budget for higher vacancy and turnover than the metro average. Require a purchase price that produces acceptable returns without any appreciation. Focus on sub-markets with stable tenant demand and avoid outlier gross yield numbers in distressed areas.
Run your own property analysis with Dynamic.RE. Turn market data into clear investment decisions, and build confidence before you commit capital.
Disclaimer
This content is for informational and educational purposes only and should not be construed as investment, legal, tax, or financial advice. Figures shown are illustrative estimates based on historical market data and assumptions that may not reflect actual results. Real estate investments involve risk, including possible loss of principal. Past performance does not guarantee future results. Investors should conduct their own due diligence and consult qualified advisors before making investment decisions.
Yield estimates are derived from county-level HUD Fair Market Rents divided by median listing prices and represent gross returns before vacancy, maintenance, management, capital expenditure, property taxes, insurance, and financing costs. They are county- and metro-wide averages, not property-level observations. Actual gross and net yields will vary materially based on specific property, ZIP code, condition, tenant profile, and operating execution. These figures are illustrative only and should not be used as a basis for any investment decision without independent property-level underwriting. Estimated returns and yield ranges shown are hypothetical illustrations. Actual results will vary based on financing, market conditions, property condition, operating expenses, and execution.
.png)