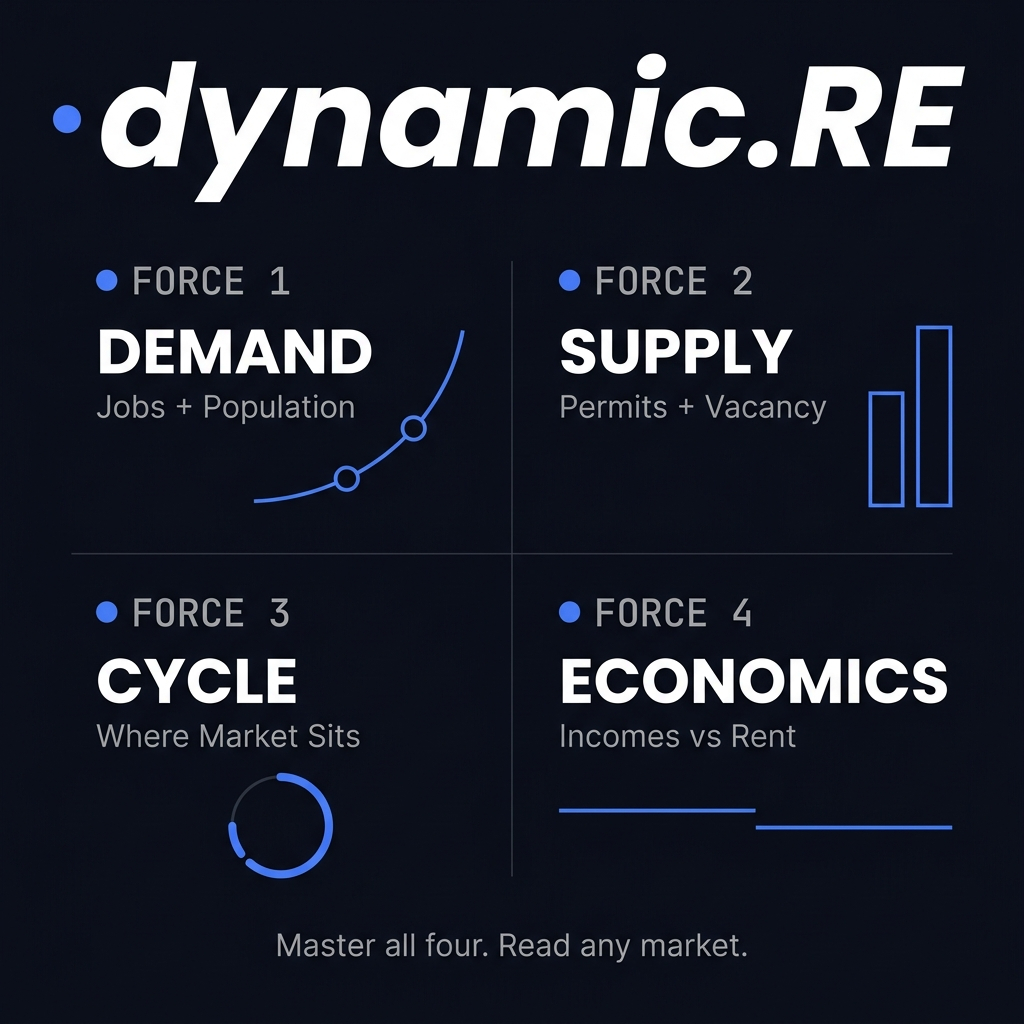
To analyze a rental market, measure four things in order: demand (jobs and population), supply (permits and vacancy), where the market sits in its cycle, and whether local incomes can sustain the rent. A market with growing jobs, constrained supply, and rents tenants can afford is structurally sound. Everything else is timing.
Key Takeaways
- Job growth is the single most important leading indicator of rental demand.
- Every new primary job creates roughly three to four supporting service jobs — the multiplier effect.
- Building permits reveal future supply 12 to 24 months before it hits the market.
- Rental markets move through four repeatable phases. Knowing which one you're in changes the play.
- Affordability sets the ceiling on rent growth. Rents can't outrun local incomes for long.
- A market analysis is only as good as the neighborhood analysis underneath it.
National headlines will mislead you. In the same year, rents surge in one metro and fall in another, driven by local jobs, local supply, and local incomes that no national average captures. Averages hide the outcomes that decide whether a deal makes money.
That gap between the headline and the street is where returns are made. This guide gives you a repeatable, evergreen framework for analyzing any rental market — the logic a disciplined investor applies before committing capital.
Every rental market comes down to demand, supply, the cycle connecting them, and the local economy that sustains the rent. Master those four forces and you can read any market.
Step 1: Define What You're Actually Analyzing
Before pulling a single number, set your scope. Citywide averages hide the details that decide outcomes. A metro can post healthy rent growth while specific ZIP codes inside it lose tenants. Mixing metro-level and neighborhood-level data without noting the difference is the most common analysis error.
Answer four questions first:
- Geography. Are you evaluating a metro, a city, or a specific ZIP code? Pick one level and stay consistent.
- Strategy. Buy-and-hold, BRRRR, mid-term rentals, and house hacking each weight the data differently.
- Time horizon. A five-year hold tolerates short-term softness that a two-year exit can't.
- Return type. Are you buying primarily for cash flow, appreciation, or both?
That last question matters more than most investors admit. The best markets deliver a property that cash-flows from day one and sits in the path of rising values. Cash flow is your hedge — it lets you hold through a downturn without being forced to sell. Appreciation is your wealth engine. You want both, but you need to know which one you're underwriting.
Do this first: Write your investment thesis in one sentence. Every data point you collect should either support it or break it. If a number can't do either, it's noise.
Step 2: Measure Demand
Demand is the engine. Everything else is a modifier.
Job Growth Comes First
People rent where they work. Job growth is the most reliable leading indicator of rental demand. When a market adds jobs, it adds renters. When jobs leave, tenants follow — often within a year.
The relationship compounds. Every new primary job (an engineer, a nurse, a manufacturing role) creates roughly three to four supporting service jobs. A city adding 5,000 primary jobs is effectively adding 15,000 to 20,000 total. Announced corporate expansions signal demand that hasn't arrived yet — and that lag is your window to buy ahead of the crowd.
What to look for:
- Employer diversity. One dominant employer is one point of failure. Markets anchored to several industries hold occupancy through cycles.
- Durable, anchored employment. Aerospace, healthcare, government, higher education, and logistics tend to hold through downturns better than lifestyle-driven demand.
- Announced expansions and closures. A corporate relocation takes two to five years to fully land — meaning it leads rent trends by many months.
Where to find it: the U.S. Bureau of Labor Statistics publishes local employment data and job growth by metro. Local economic development offices will tell you what's committed but not yet built.
Then Measure Who's Moving In
Job growth pulls people. Population growth confirms they came. A market gaining residents can support rising rents through simple supply and demand. A market losing residents can't, no matter how good the headline rent looks.
Track population and migration at the county level using U.S. Census Bureau data. You're looking for a multi-year trajectory, not a single year. In-migration is a stronger signal than natural growth, because it reflects the market's actual pull.
Then Check the Rent-Versus-Buy Math
Homeownership cost shapes rental demand directly. When owning a starter home costs far more than renting the equivalent, households stay renters longer. When buying is cheap relative to renting, your best tenants become buyers and compete with your product.
Calculate the rent-versus-buy spread for your specific market. A wide gap is a structural tailwind for landlords. A narrow one signals that ownership is pulling demand away.
Step 3: Measure Supply
Strong demand means nothing if construction outpaces it. Supply is the force that turns a boom into a bust — and the one most investors ignore until it's too late.
Permits Are Your Early-Warning System
Building permits reveal future supply 12 to 24 months before it hits the market. It takes two to three years to plan, permit, and build. When everyone loves a market, builders pull permits aggressively — and that pipeline keeps pouring supply onto the market long after demand has been met. That overshoot is what softens rents and lifts vacancy.
Pull permit and housing-start data from the U.S. Census Bureau's New Residential Construction reports. Compare permits and units under construction as a share of existing housing stock. A thousand new units means something very different in a small metro than in a large one.
Read the Supply Signals
Your supply checklist:
- Vacancy rate relative to the market's own history and to comparable metros. Above-average vacancy means your unit sits empty more often — and vacancy is a landlord's most expensive line item.
- Absorption pace. How quickly new units actually lease up. Slowing absorption while the pipeline is still full is a red flag.
- Days on market for rentals and for sales. Rising days-on-market is one of the earliest signs a market is turning.
- Barriers to entry. Markets that are hard to build in — limited land, long permitting timelines, water or zoning constraints — protect existing owners. The harder it is to add supply, the safer your rents.
Warning: A market can look cheap precisely because a construction pipeline is about to flood it. Always check permits before you trust the price.
Step 4: Locate the Market in Its Cycle
This is the step almost every guide skips — and it's the one that separates timing from luck.
Rental markets move through four repeatable phases. A full cycle typically runs 10 to 25 years, faster on the coasts and slower in the heartland. Knowing which phase a market is in tells you whether to buy for cash flow, buy for appreciation, or wait entirely.
- Buyer's Market I: Oversupply, high vacancy, falling prices, high foreclosures, little construction. Jobs flat or leaving. Buy only for strong cash flow — and only if you know positive change is coming.
- Buyer's Market II: Oversupply absorbing, rents beginning to rise, days-on-market falling, values climbing. Jobs returning, migration resuming, little new construction yet. The emerging-market sweet spot — buy and hold aggressively.
- Seller's Market I: High demand, bidding wars, rising rents and prices, construction ramping. Employment and wages peaking. Both flip for gains and hold for appreciation — but stop overpaying.
- Seller's Market II: Rising days-on-market, excess pipeline delivering, price cuts begin. Job growth stalls, overbuilding sets in. Sell early and move on — the riskiest phase to hold.
The transition from Buyer's Market II to Seller's Market I happens at the point of equilibrium — when absorption and rents finally rise enough to make new construction pencil out again. That's when builders return and the supply clock restarts.
Two forces warn you a market is rolling into the dangerous Seller's Market II phase: job growth stalling and supply overshooting. Watch permits and days-on-market together. When both turn against you, the smart money is already leaving.
The practical takeaway: don't ask only "is this market good?" Ask where in the cycle it is — and whether it's heading up or down. A mediocre property early in an upswing beats a great property at the top.
Step 5: Read the Local Economics Underneath
Rent levels tell you where a market is. Tenant finances tell you where it can go. This is the ceiling check — and it's where over-optimistic underwriting falls apart.
Affordability Sets the Ceiling
Rents can't outrun local incomes for long. When tenants are financially stretched, your realistic rent-growth ceiling is lower than trailing data suggests, and delinquency risk is higher. Affordability pressure is a structural constraint on upside — not a footnote.
Evaluate:
- Rent-to-income ratio in your target tenant segment. The wider the gap between prevailing rents and what locals earn, the more fragile your rent growth.
- Income growth trend. Incomes set the ceiling on future rent increases. Rents rising faster than incomes for years is a warning sign — that gap closes eventually, and it closes on the landlord.
- Population and demographic trajectory at the county level, from Census data.
You can benchmark local rents against HUD's Fair Market Rents, published annually by bedroom count for every county — a stable, public reference point for what a market's rents actually support.
Don't Forget the Cost Side
A market analysis that ignores expenses is only half done. Two structural costs vary enormously by market and can quietly erase a solid rent number:
- Property taxes and insurance. In some markets — especially coastal and disaster-exposed ones — insurance and taxes swing net returns more than rent does. Underwrite them locally, not with a national rule of thumb.
- Climate and catastrophe exposure. Flood zones, storm risk, and insurability increasingly determine whether a market's returns hold. Check them before you fall in love with the yield.
Step 6: Grade the Neighborhood
A market decision is really a neighborhood decision. Neighborhoods inside the same city can behave like different countries.
Investors grade locations on an A-through-D class system:
- Class A: Newest buildings, best schools, highest incomes, highest rents, lowest cash flow. The easy, expensive investment.
- Class B: Solid middle-class areas, slightly older stock, blue-collar and professional tenants. The balance point most buy-and-hold investors target.
- Class C: Older, lower-income areas. Cheaper to buy, higher maintenance, more management-intensive.
- Class D: High-crime, high-vacancy areas that require real expertise and carry real risk. Most investors should avoid them.
A common value-add strategy: buy a Class C property in a Class B area — improving the asset while the location carries the demand.
Then layer in the neighborhood signals that averages miss:
- Crime. Use crime-mapping tools by ZIP code. Maps can't show perception or the invisible borders between a safe block and a rough one — only talking to locals reveals those.
- Schools. The single most-cited factor renters with children care about. Good school zones command higher rents and lower vacancy.
- The retailer proxy. When a national grocer or major retailer opens nearby, they've already spent millions researching that area's growth. Let their due diligence support yours.
- Transit and employment access. Proximity to transit and major job centers widens your tenant pool. Economic growth tends to follow the rail line.
- The path of progress. Identify the direction a city is growing and buy in front of it, not behind it. Local property managers will tell you which way the path runs.
If you're investing out of your home market, this step is where a strong local team earns its keep. A deal-finding agent, a lender, a property manager, and a contractor become your eyes on the ground. A good property manager is also a free market-intelligence source — they know vacancy, rents, and which streets to avoid before any dataset does.
Step 7: Stress-Test, Then Match the Market to a Strategy
Balanced analysis includes the downside. This is the step that protects your capital — and the one most often skipped.
Run the Scenarios
- Vacancy shock. Model vacancy three to five points above current levels. If cash flow survives, you have a margin of safety.
- Flat rent growth. Underwrite the deal assuming zero rent increases for three years. Deals that only work if rents keep climbing aren't deals — they're bets.
- Employer risk. Estimate the impact if the largest local employer cut a fifth of its workforce. Concentrated economies fail fast.
- Rate and insurance shock. Model higher financing costs and a meaningful insurance premium increase. Both have proven they can move faster than rents.
- Regulatory shift. Check for pending rent control, zoning changes, or landlord-tenant legislation in the jurisdiction.
Demand momentum reverses faster than most models assume. A market that looked strong mid-year can soften sharply by year-end when jobs weaken or migration shifts. Build that possibility in before you need it. A positive cash-flow cushion is what lets you hold through it.
Match the Profile to the Play
The final step turns analysis into a decision:
- Tight supply, steady jobs, moderate prices (early upswing): Buy-and-hold works well. This is the emerging-market sweet spot.
- High vacancy, falling rents, stalled jobs (downswing): Wait, or negotiate hard on price with conservative rent assumptions.
- Strong mid-term demand anchors (hospitals, universities, project-based employers): Mid-term rentals aimed at traveling healthcare workers and relocating families.
- Wide rent-versus-buy spread: Extended tenant tenure favors long-term holds.
- Late-cycle, overbuilding, bidding wars: The most dangerous time to buy. Discipline beats FOMO.
Structured, comprehensive data reduces the risk of acting on an assumption that no longer reflects local conditions. The goal isn't to remove judgment — it's to make sure your judgment is pointed at current reality instead of last year's story.
Your Rental Market Analysis Checklist
Before you commit capital, confirm you can answer yes to each:
- I defined my geography, strategy, time horizon, and return type.
- I verified job growth, employer diversity, and in-migration.
- I calculated the local rent-versus-buy spread.
- I checked current vacancy and the building-permit pipeline.
- I identified which cycle phase the market is in — and its direction.
- I confirmed local incomes can sustain the rent, including taxes and insurance.
- I graded the specific neighborhood, not just the metro.
- I stress-tested the deal against higher vacancy and flat rents.
- I matched the market profile to a specific strategy.
A market that passes every step deserves deeper underwriting. A market that fails two or more deserves your patience.
The Investor Takeaway
Rental market analysis is a discipline. It rewards structure over instinct. Demand tells you whether tenants will show up. Supply tells you whether they'll have alternatives. The cycle tells you whether you're early or late. Local economics tell you whether the trend can hold.
Markets move in cycles. Revisit this analysis at least twice a year on any market you own. The framework doesn't expire — only your inputs do.
Ready to put this framework to work? Run your own property and market analysis with Dynamic.RE and turn market noise into investment clarity.
Frequently Asked Questions
How do you analyze a rental market?
Analyze a rental market in four moves: measure demand (job and population growth), measure supply (building permits and vacancy), identify where the market sits in its cycle, and confirm local incomes can sustain the rent. Then grade the specific neighborhood and stress-test the downside.
What is the most important factor in a rental market?
Job growth is the most important factor. People rent where they work, so employment trends lead rental demand. A market adding diverse, durable jobs will attract renters and support rising rents. A market losing jobs will lose tenants, usually within a year.
What is the multiplier effect in real estate?
The multiplier effect describes how each new primary job creates roughly three to four supporting service jobs. A metro adding 5,000 primary jobs effectively adds 15,000 to 20,000 total jobs, amplifying rental demand well beyond the headline hiring number.
How do building permits predict a rental market?
Building permits predict supply 12 to 24 months ahead, because it takes two to three years to permit and build. A market issuing permits faster than its population is growing risks future oversupply, rising vacancy, and stalling rent growth once that pipeline delivers.
What are the four phases of a real estate market cycle?
The four phases are Buyer's Market I (oversupply, falling prices), Buyer's Market II (recovery and rising rents), Seller's Market I (peak demand and bidding wars), and Seller's Market II (overbuilding and decline). A full cycle typically runs 10 to 25 years.
What is a neighborhood class in real estate?
Neighborhood class is an A-through-D grading of a location's quality. Class A is newest and most expensive with the lowest cash flow. Class B is solid middle-class. Class C is older and lower-income. Class D is high-risk. Most investors target Class B and C areas.
What is the price-to-rent ratio?
The price-to-rent ratio compares median home prices to median annual rents in a market. A high ratio signals that buying is expensive relative to renting, which tends to keep households in the rental market longer and extends a landlord's demand runway.
How do you analyze a rental market you can't visit?
Analyze an out-of-market area with public data and a local team. Use Census, BLS, and HUD data for the fundamentals, then rely on a trusted local agent, property manager, and contractor to verify neighborhood conditions, rents, and property quality on the ground.
Should I buy for cash flow or appreciation?
Aim for both. Cash flow is a hedge that lets you hold through downturns without being forced to sell. Appreciation builds wealth faster. The best markets offer a property that cash-flows from day one and sits in the path of rising values.
How often should I re-analyze a rental market?
Re-analyze any market you own at least twice a year. Job growth, permits, and migration can shift quickly, and demand momentum reverses faster than most models assume. Regular checks let you spot a market rolling over before it costs you.