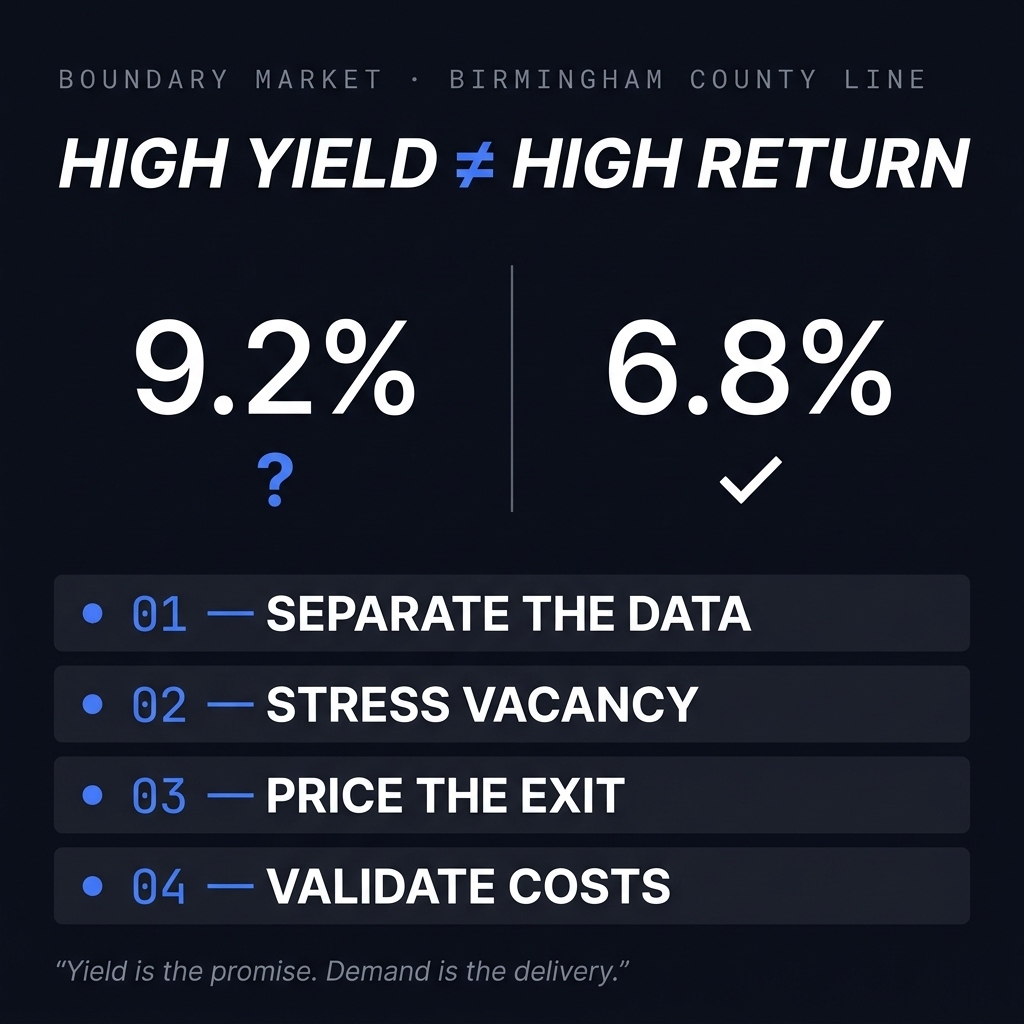
TL;DR: Cleveland's cheapest ZIP (44105, Slavic Village) posts a 20.8% gross yield but a demand score of 11.5 out of 100. The west-side ZIPs (44109, 44111) yield roughly half as much but absorb at Sun Belt-beating rates. Rank by demand first. Yield second. The cheapest ZIP is a demand discount, not a cash-flow opportunity.
44105 (Slavic Village): 20.8% yield, demand score 11.5, pending ratio 0.503. Homes sit 55 days. Population falling 2.7%/yr. Engine flags: weak-demand, cheap-and-declining.
44111 (West Park): 11.6% yield, demand score 59.8, pending ratio 0.898. Homes clear in 34 days. No engine flags.
44109 (Old Brooklyn): 11.8% yield, pending ratio 0.928 (highest in the set), prices up 19.7% YoY. No engine flags.
Cleveland's west-side ZIPs out-absorb Indianapolis (0.54) and Tampa (0.37) — inside a county with essentially flat population growth.
44105 works as a specialist Section 8 hold, not as market-rate cash flow. Exit-liquidity risk is real and must be underwritten explicitly.
The Number Pulling Investors Into Cleveland Right Now
Search for Cleveland cash flow in 2026 and the same ZIP keeps coming up: Slavic Village, 44105. Median list price around $95,000. Headline 3-bedroom gross yield of 20.8%, among the highest in Dynamic.RE's tracked markets. It looks like a deal.
Dynamic.RE's demand data ranks 44105 last among the Cleveland ZIPs analyzed.
Demand score: 11.5 out of 100
Pending ratio: 0.503
Days on market: 55
Population trend: -2.7% per year
The yield ranking and the demand ranking point in opposite directions. That inversion is what this analysis is about.
A high rent-to-price ratio in the cheapest ZIP is a demand discount, not a cash-flow opportunity.
Knowing which Cleveland ZIPs actually clear the demand gate requires a different starting point than price and yield alone.
Key Point: The highest-yield ZIP in this analysis is also the weakest-demand ZIP. That's the central tension every Cleveland investor needs to understand before shortlisting a single address.
Why the Popular Cleveland Lists Get This Wrong
The dominant third-party "cheap Cleveland cash-flow" lists follow the same logic: rank on price and yield, flag the cheap east side as exceptional value, call Slavic Village an affordable cash-flow play. Several actively promote 44105 on affordability grounds.
None of them gate on ZIP-level demand score or absorption. That's the gap.
Yield is a ratio. It measures price relative to rent, nothing more. It doesn't measure whether the unit rents, how fast it rents, or whether a buyer will want it at exit. A 20.8% gross yield in a ZIP with a demand score of 11.5 and a pending ratio of 0.503 is signaling something the yield itself can't show: the market isn't clearing. The cheap price reflects weak demand, not undiscovered value.
The three metrics that actually answer the investor's core question, will this rent and can I exit, are demand score, pending ratio, and days on market. In Cleveland, those three metrics produce a ranking that's the inverse of the yield table.
Key Point: Yield measures price vs. rent. It says nothing about whether the unit rents, stays rented, or sells. Demand score, pending ratio, and DOM answer those questions.
The Data: Cleveland ZIP Codes Ranked by Demand
Dynamic.RE pulled ZIP-level data for three Cleveland ZIPs and benchmarked them against the city average. Data current as of June 2026.
Is 44111 (West Park) the Strongest Demand ZIP in Cleveland?
44111 — West Park (west side)
Median list price: $169,722 | Gross yield: 11.6% | Demand score: 59.8 | Pending ratio: 0.898 | Days on market: 34 | Hotness score: 72 | Price YoY: -4.3% | Engine flags: none
West Park is the fastest-moving ZIP in the set. At a pending ratio of 0.898, nearly one home goes under contract for every active listing. Homes clear in 34 days, twelve days faster than the city average of 46. The demand score of 59.8 sits above the city baseline of 55.6. No risk flags.
Is 44109 (Old Brooklyn) Showing Both Cash Flow and Appreciation?
44109 — Old Brooklyn (west side)
Median list price: $166,975 | Gross yield: 11.8% | Demand score: 39.0 | Pending ratio: 0.928 | Days on market: 44 | Price YoY: +19.7% | Engine flags: none
Old Brooklyn posts the highest pending ratio in the set at 0.928. Prices are up 19.7% year-over-year, making this the only ZIP showing both cash-flow yield and price appreciation simultaneously. No engine risk flags. The +19.7% print is a single-ZIP, low-volume data point, and investors should corroborate it before treating it as a durable trend. The direction is consistent with the demand signal.
Key Point: Both west-side ZIPs absorb at near-Sun Belt rates with no engine risk flags. West Park leads on speed; Old Brooklyn leads on raw absorption and price direction.
The ZIP the Lists Love — and What the Demand Data Says
Is 44105 (Slavic Village) Actually a Good Cash-Flow Investment?
44105 — Slavic Village (east side)
Median list price: $95,000 | Gross yield: 20.8% | Demand score: 11.5 | Pending ratio: 0.503 | Days on market: 55 | Price YoY: -3.3% | ZCTA population CAGR: -2.7%/yr | Engine flags: weak-demand, cheap-and-declining
The 20.8% gross yield uses the Cuyahoga County HUD 3-bedroom Fair Market Rent of $1,646 against a $95,000 median list price. Two problems with that number.
County-wide FMR overstates what Slavic Village units actually command at market rate. The realizable yield is meaningfully lower.
A demand score of 11.5 and a pending ratio of 0.503 mean the market isn't absorbing at the rate the yield implies it should.
Homes in 44105 sit for 55 days on average versus 34 in West Park. The ZCTA is losing population at 2.7% per year. Prices are down 3.3% year-over-year. The engine flags this ZIP with two tags: weak-demand and cheap-and-declining.
The yield is high because demand is low. That's not a feature. That's the definition of a demand discount.
⚠️ Note on yield accuracy: Gross yields shown are hypothetical illustrations derived from HUD Fair Market Rents and median list prices. They are not net returns and do not account for vacancy, management, insurance, maintenance, or financing. The 44105 headline yield is particularly likely to be overstated. Actual ZIP-level rent comps should be verified before any underwriting.
Key Point: 44105's yield is a function of its low price, and its low price is a function of weak demand. The number that looks most attractive is the one that needs the most scrutiny.
Does a Shrinking Metro Mean You Should Avoid Cleveland?
Cleveland is a shrinking metro. Cuyahoga County has grown at roughly +0.08% per year over the past five years and is down approximately 2% since 2010. The city proper is losing residents. A standard growth-market filter would never send a systematic investor here.
And yet: 44111 posts a pending ratio of 0.898. 44109 posts 0.928.
For context: Indianapolis, one of the most-discussed growth markets in SFR investing, posts a city-level pending ratio of 0.54. Tampa posts 0.37. Cleveland's west-side ZIPs are out-absorbing both, inside a county with essentially flat population growth.
Note: Indianapolis and Tampa figures are city-level aggregates. Cleveland's west-side figures are ZIP-level. The comparison is directional, not identical-basis.
Key Point: Metro population growth is an overrated buy screen. Cleveland's west-side ZIPs out-absorb growth markets on raw pending ratio. Local absorption is the real signal.
What Drives West-Side Absorption in a Shrinking Metro
Population decline at the metro level doesn't mean demand disappears. It often means demand consolidates.
Households leaving the weakest tracts, like 44105 which is losing 2.7% of its population annually, frequently stay in the metro and move toward neighborhoods with stronger housing stock, better amenities, and more stable tenant bases.
That consolidation is visible in the absorption data. The west-side ZIPs are capturing demand that the east side is releasing. The result is Sun Belt-level pending ratios in a Rust Belt metro — precisely what a demand-first screen surfaces, and what a metro-level population filter would cause an investor to miss entirely.
Key Point: Demand doesn't vanish in a shrinking metro. It moves. The west-side absorption data shows exactly where it's going.
The Honest Exception: Should You Invest in 44105 Through Section 8?
44105 is not uninvestable. It requires an honest framing of what kind of investment it actually is.
Cleveland's Cuyahoga Metropolitan Housing Authority administers roughly 15,000 to 16,000 Housing Choice Vouchers. A documented shortage of HQS-compliant units means properties that pass inspection in the east side can achieve low vacancy through the Section 8 channel. For an operator with voucher-program experience, 44105 can cash-flow.
But that's a voucher-dependent hold, not market-rate cash flow. Dynamic.RE's demand score, pending ratio, and days-on-market measure market-rate absorption and exit liquidity: the ability to re-rent at market and to sell when the hold period ends. On those metrics, 44105 scores near the floor.
A voucher strategy doesn't resolve the exit-liquidity risk. It defers it.
Investors evaluating 44105 through a Section 8 lens should underwrite the exit explicitly: what does a buyer pay for a voucher-dependent asset in a depopulating, weak-demand ZIP? That's the question the 20.8% yield doesn't answer.
Key Point: Section 8 is a viable specialist strategy for 44105. It is not a substitute for market demand, and it doesn't resolve exit-liquidity risk. Underwrite the exit before committing to the hold.
How to Screen Any Cleveland ZIP Before You Shortlist a Property
The methodology here is transferable. Before evaluating a single listing, rank candidate ZIPs by demand and absorption first, yield second. In Cleveland, that sequence produces a clear result:
44111 — West Park. Demand score 59.8, pending 0.898, DOM 34, hotness 72. Strongest demand signal in the set. No engine flags. Market-rate rental and exit liquidity are both supported by the absorption data.
44109 — Old Brooklyn. Pending 0.928 (highest in the set), price +19.7% YoY, no engine flags. Cash flow and appreciation in the same ZIP, unusual for this market tier. Corroborate the price trend before treating it as durable.
44105 — Slavic Village. Demand score 11.5, pending 0.503, DOM 55, population -2.7%/yr, engine flags: weak-demand and cheap-and-declining. The headline yield is overstated by county-wide FMR. Market-rate cash flow is not supported by the absorption data. Section 8 is a viable specialist strategy with explicit exit risk, not a substitute for market demand.
Key Point: The screen is simple: demand score and pending ratio first, yield second. In Cleveland, that order produces a completely different shortlist than the one most public lists serve.
Key Takeaways
Cleveland's highest-yield ZIP (44105, 20.8%) is also its weakest-demand ZIP. That's a demand discount, not a value opportunity.
The west-side ZIPs (44111 and 44109) yield 11.6% to 11.8% and absorb at pending ratios of 0.898 to 0.928, beating Indianapolis and Tampa on raw absorption.
Metro population decline doesn't disqualify a market. ZIP-level absorption tells you where demand is actually going.
44105 can work as a Section 8 specialist hold. It doesn't work as market-rate cash flow, and the exit risk must be explicitly underwritten.
The 20.8% headline yield is overstated. It uses a county-wide FMR against a median list price. Verify ZIP-level rent comps before any underwriting.
The demand-first ranking inverts the yield table. Investors who screen on absorption before yield arrive at a fundamentally different Cleveland shortlist.
Frequently Asked Questions
What are the best Cleveland ZIP codes for rental investors in 2026?
Based on demand score, pending ratio, and days on market, 44111 (West Park) and 44109 (Old Brooklyn) rank ahead of 44105 (Slavic Village) despite lower headline yields. Both west-side ZIPs carry no engine risk flags and absorb at rates that compare favorably to major growth markets.
Why does 44105 (Slavic Village) have the highest yield but rank last on demand?
The 20.8% gross yield in 44105 is a function of its low median list price (~$95,000). That low price reflects weak market demand, not undiscovered value. The demand score is 11.5 out of 100, the pending ratio is 0.503, and the ZIP is losing population at 2.7% per year.
Is Cleveland a good market for SFR investors given its shrinking population?
Population decline at the metro level is an overrated filter. Cleveland's west-side ZIPs post pending ratios of 0.898 to 0.928, higher than Indianapolis (0.54) and Tampa (0.37) on a city-aggregate basis. Demand consolidates inside shrinking metros; absorption data shows where it goes.
Does Section 8 make 44105 a viable investment?
For an experienced voucher-program operator, yes. CMHA administers roughly 15,000 to 16,000 Housing Choice Vouchers, and HQS-compliant units in the east side can achieve low vacancy through that channel. The risk is exit liquidity: what a buyer will pay for a voucher-dependent asset in a depopulating ZIP is a separate and critical underwriting question.
What is a demand score and why does it matter for rental investing?
Dynamic.RE's demand score is a composite of buyer and renter pull signals at the ZIP level. A score of 11.5 (44105) means the market is near the floor of absorption activity. A score of 59.8 (44111) means the market is absorbing above the city baseline. High demand scores correlate with faster renting, stronger exit liquidity, and lower vacancy risk.
What is a pending ratio and what does it tell investors?
The pending ratio measures homes under contract relative to active listings. A ratio of 0.928 (44109) means nearly one home is going under contract for every active listing, a very strong absorption signal. A ratio of 0.503 (44105) means roughly one contract for every two active listings, indicating the market is not clearing efficiently.
Is the 20.8% yield in 44105 accurate?
It's a hypothetical gross yield calculated using the Cuyahoga County HUD 3-bedroom Fair Market Rent of $1,646 divided by the median list price of $95,000, annualized. It is not a net return. It does not account for vacancy, management, insurance, maintenance, or financing. ZIP-level market rents in Slavic Village are likely lower than the county-wide FMR, which means the realizable yield is meaningfully below 20.8%.
How should investors screen Cleveland ZIPs before shortlisting properties?
Rank candidate ZIPs by demand score, pending ratio, and days on market first. Then layer in yield and price trend. In Cleveland, that sequence moves 44111 and 44109 to the top of the list and flags 44105 as a specialist or pass, regardless of its headline yield.
Disclaimer: This content is for informational and educational purposes only and should not be construed as investment, legal, tax, or financial advice. Figures shown are illustrative estimates based on historical market data and assumptions that may not reflect actual results. Real estate investments involve risk, including possible loss of principal. Past performance does not guarantee future results. Investors should conduct their own due diligence and consult qualified advisors before making investment decisions. Estimated yields are hypothetical illustrations only. Actual results will vary based on financing, market conditions, property condition, operating expenses, and execution.
.png)