A new LendingTree and U.S. Census study, released July 7, 2026, and widely reported July 9, put a striking number in front of investors: 14.5 million vacant homes across the United States — roughly one in every ten housing units sitting empty.
The chart went everywhere. And investors started asking two very reasonable questions:
Is this a wave of buying opportunity? And how do I tell a real deal from a dead one?
The honest answer is that the headline number is nearly useless on its own — and the state-level map built from it is actively misleading for anyone trying to make a buying decision. Not because the data is wrong, but because it blends four completely different situations into a single figure, and those situations require entirely different strategies.
Here is how to decompose it, and what actually separates a buyable vacant home from a value trap.
"14.5 Million Vacant Homes" Is Actually Four Different Markets
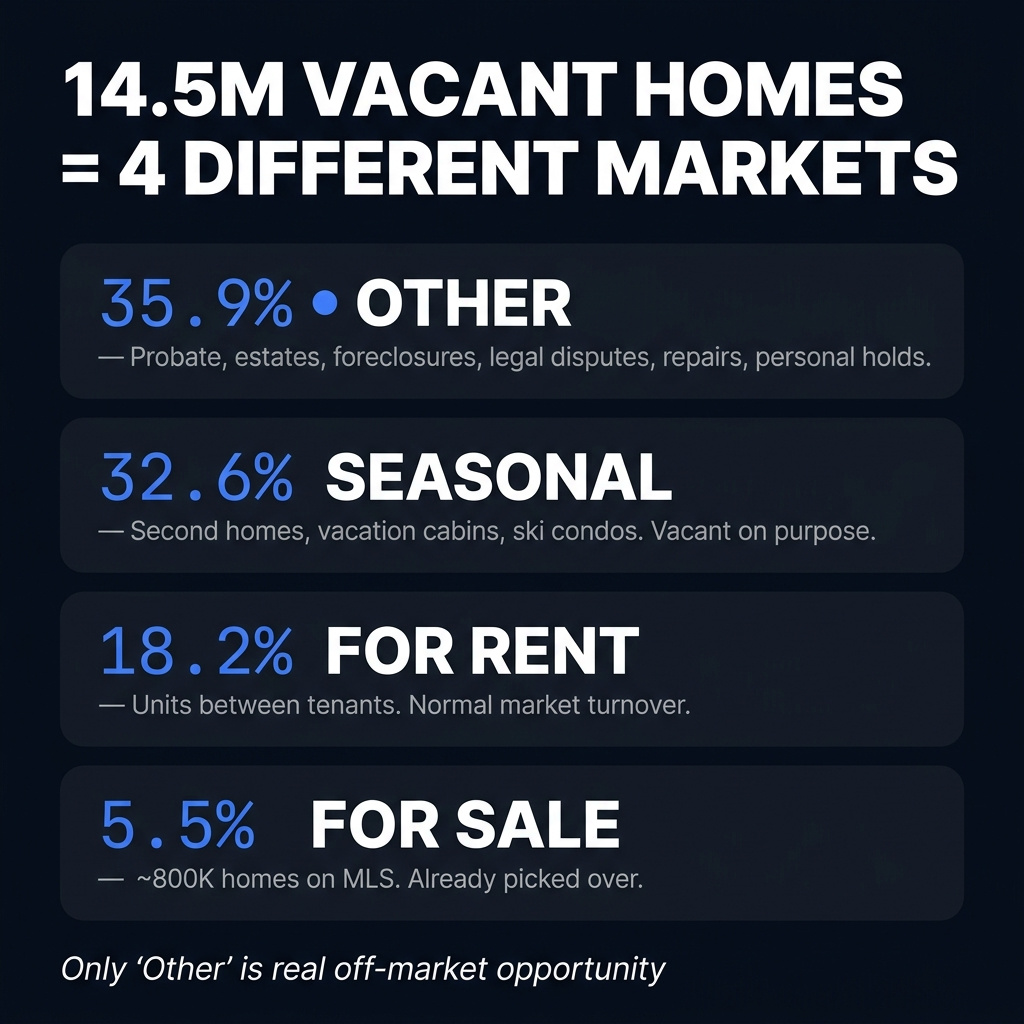
The Census doesn't just count vacant homes — it categorizes them. The LendingTree study breaks the 14.5 million down as follows:
35.9% — "Other": Probate and estate properties, foreclosures, homes tied up in legal proceedings, properties that need repair, and homes held for personal reasons. This is the largest single category.
32.6% — Seasonal: Second homes, vacation cabins, beach houses, ski condos. Vacant on purpose. Not distressed.
18.2% — For rent: Available rental units between tenants. A normal part of any functioning rental market.
5.5% — For sale: The roughly 800,000 homes actually listed and available to buy. The MLS you can already shop — and that is already picked over.
The remaining share is split between homes already sold or rented but not yet occupied, and a negligible migrant worker housing category.
That breakdown matters because each category tells a completely different story. A snowbird's beach condo in Maine, an abandoned shell in a shrinking Mississippi county, and a healthy rental between tenants are all counted as "vacant." They have nothing in common as investment targets.
The headline number doesn't tell you where the opportunity is. It tells you where to start asking better questions.
The High-Vacancy States Are High for the Boring Reason
Maine leads the country at 20.6% vacancy. Vermont and Alaska are close behind. These states have attracted significant investor and media attention as a result.
They should not.
Maine, Vermont, and Alaska also have some of the highest seasonal-home concentrations in the country. According to LendingTree's own analysis, the ten highest-vacancy states average a median home value of just $247,850 — well below the roughly $408,000 median of the ten lowest-vacancy states. These are not expensive markets overrun with second homes. They are lower-cost markets where a large share of the housing stock is recreational property held off-market seasonally. Vermont, for example, has nearly three-quarters of its vacant homes classified as seasonal or recreational. The vacancy rate is high because those cabins and lake houses sit empty most of the year — not because there is a wave of distressed inventory to acquire.
Matt Schulz, the LendingTree analyst who authored the study, put it plainly: "The key question isn't how many homes are vacant, but how many are available… real estate trends tend to be hyperlocal."
High state vacancy does not mean cheap. It often means the opposite.
Connecticut, by contrast, sits at 7.0% — the lowest in the country. That low vacancy reflects tight supply and persistent demand, not an absence of opportunity. It means competition is fierce and entry prices reflect it.
The state vacancy rate is a blunt instrument. It cannot tell you whether a specific market has collectible rents, a functioning resale market, or a tenant base that is growing or shrinking.
The Real Off-Market Pool: The "Other" 35.9%
Here is where the actual investor story lives.
The 35.9% "Other" category — probate, estate, foreclosure, tax-delinquent, needs-repair — is the inventory that never appears on the MLS. This is the pool that experienced BRRRR buyers, probate specialists, and off-market acquisition teams are sourcing from. It is legitimate, it is large, and it is genuinely under-covered by the mainstream housing press.
Mississippi makes the case most clearly. According to the study, Mississippi has the highest share of "Other" vacancies in the country — 62.5% of its vacant homes fall into this category. The study specifically cites a $211,000 foreclosed four-bedroom in Pearl that sits vacant because it requires a specialized rehab loan most buyers cannot access. That financing friction is precisely what creates the opportunity for investors who can navigate it.
But Mississippi also illustrates the trap with equal clarity.
A large "Other" pool is a deal list. Whether the deals are worth buying depends entirely on what the local market can absorb.
The Coin Flip: Why Local Absorption Decides Everything
Consider two markets separated by less than fifteen miles in central Mississippi. Both sit inside the same state vacancy figure. Both draw from the same "Other" pool. They are not the same investment.
Jackson (Hinds County) shows a gross yield of 15.5% at a median list price of $119,610. That headline number looks like an exceptional cash flow opportunity.
Look underneath it:
Pending ratio: 0.40 — for every ten homes listed, only four are moving toward contract. Demand is thin.
Days on market: 81 — properties are sitting, not moving.
Price trend: −8.3% year-over-year — the market is repricing downward.
County population CAGR: −1.8% per year, with the ZIP-code level running at −2.5% annually.
Jackson is depopulating. The tenant base is shrinking. The resale pool is shrinking. A 15.5% gross yield on a $120,000 house means very little if the rent is not collectible and the exit does not exist.
Pearl (Rankin County), next door, tells a different story at a 7.5% gross yield and a median list price of $248,475.
Pending ratio: 0.66 — meaningfully healthier absorption.
Days on market: 46 — homes are moving at a normal pace.
County population CAGR: +0.7% per year — the market is growing.
Pearl's monthly price prints are volatile on low transaction volume, so the population trend and absorption rate are the more reliable read. Both point in the same direction: demand exists, tenants have somewhere to go, and a resale market functions.
Same state. Same state vacancy figure. Same "Other" pool. Opposite investment realities.
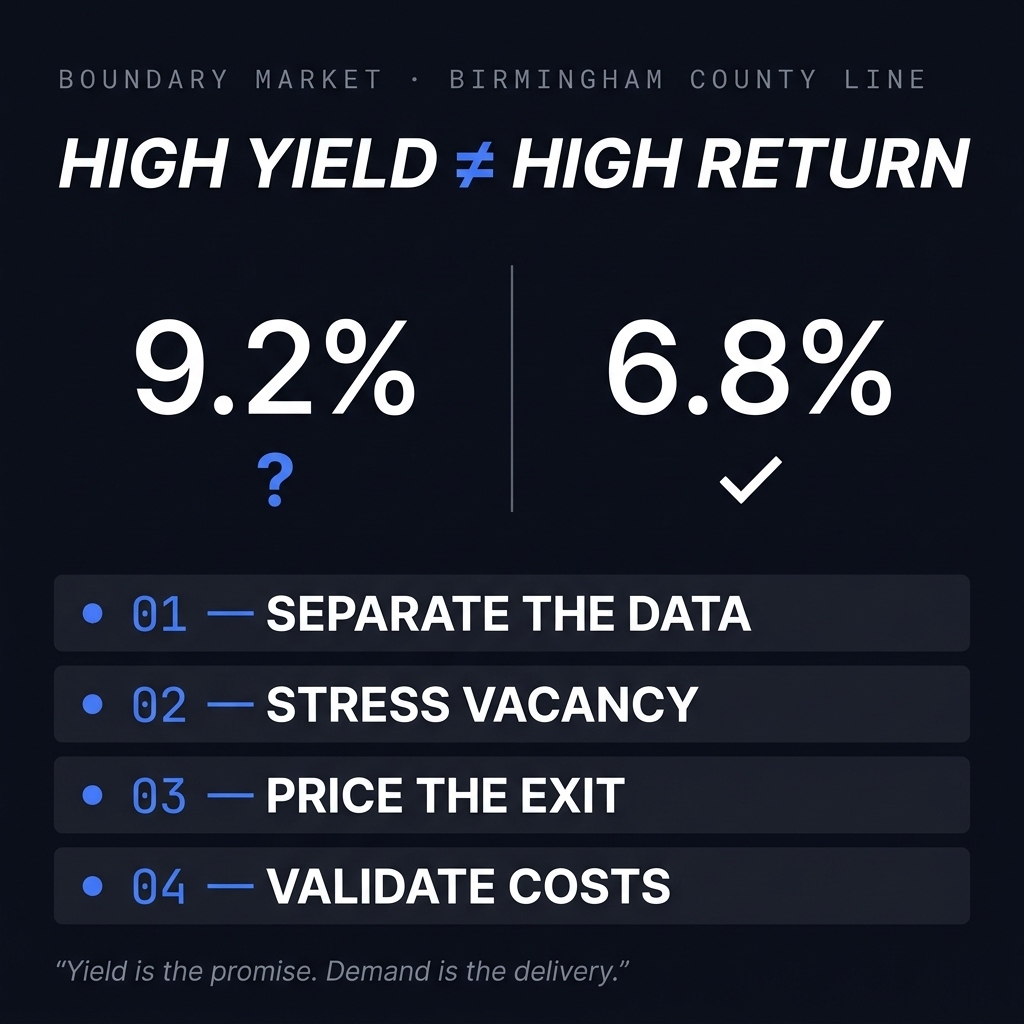
The lower headline yield with functioning demand is the better investment. The higher headline yield on hollow demand is the trap.
The Same Pattern Holds Elsewhere
Jackson and Pearl are not a Mississippi anomaly. The same absorption split appears in every market where headline metrics and ground-level demand have diverged.
In the Detroit metro, the core ZIP code 48224 posted a 23.3% gross yield at an $88,625 median as of June 2026 — one of the highest raw yield figures in any major market. Its pending ratio sits at 0.38, meaning roughly three in five listings are not moving toward contract. Compare that to Redford Township in the outer ring: a 12.2% yield, a pending ratio of 0.88, and essentially no demand-side flags. The yield spread is wide; the actual investment quality gap is wider. (See our full Detroit ring-vs-core analysis for the complete breakdown.)
In Tampa, Florida posts a 14.7% state vacancy rate — fifth-highest nationally — with a substantial seasonal share driving much of that figure. Tampa itself is a +1.4% annual population growth metro. The state "high vacancy" signal reads as caution; the metro fundamentals read as durable demand. The state number would have pointed an investor away from one of the more resilient Sun Belt growth markets. (See our full Tampa market analysis.)
In both cases, the state vacancy rate predicted nothing. The pending ratio and population trend predicted everything.
The Framework: How to Read Any Vacancy Signal
When a vacancy figure — national, state, or local — lands in front of you, run it through this sequence before acting:
Decompose it. Is the vacancy driven by seasonal homes, for-rent turnover, for-sale listings, or "Other"? Each category requires a different strategy. Only "Other" represents genuine off-market sourcing opportunity.
Discard the state rate. It blends markets that have nothing in common. It cannot tell you whether demand exists in the specific county or ZIP you are evaluating.
Pull the pending ratio. This is the single most direct measure of whether buyers and renters are actually showing up. A pending ratio below 0.50 signals thin demand. Above 0.75 signals a functioning market.
Check days on market. DOM above 60–70 days in a market with high "Other" vacancy is a compounding warning sign. Properties are sitting because demand is not there to absorb them.
Confirm the population trend. Absorption metrics can fluctuate month to month. Population trend is the durable signal underneath them. A shrinking county with thin absorption is not a turnaround story — it is a structural problem. A growing county with healthy absorption has the demand foundation that makes rental income collectible and exits executable.
Underwrite the exit, not just the entry. A cheap "Other" acquisition in a depopulating market may clear the purchase hurdle. It will not clear the exit hurdle. Before bidding on any vacant or foreclosure deal, confirm that the resale and rental markets at that price point are active.
What This Means for Your Next Move
The LendingTree study is not a buying signal or a warning sign. It is a screening layer — and a useful one. The 35.9% "Other" pool is real, it is large, and it does contain legitimate off-market opportunities that will never appear on the MLS. Probate, foreclosure, tax-delinquent, and needs-repair inventory is where experienced operators have always found margin.
The discipline is in the gate, not the sourcing. Any vacant or foreclosure property can look attractive at the entry price. The question the state vacancy map cannot answer — and the one that actually decides the investment — is whether the local market will support the rent and the exit.
Pending ratio. Days on market. Population trend. Those three data points, pulled at the city or ZIP level for your specific target market, will tell you more about a specific vacant house than any state-level chart. All Jackson and Pearl figures reflect city-level market data through June 2026; Detroit figures reflect ZIP-level data through June 2026; Redford through March 2026.
Before you bid on a vacant or foreclosure deal, pull the pending ratio and days-on-market for that ZIP in Dynamic.RE. The platform surfaces demand signals, absorption trends, and population data for any city or ZIP in the country — the exact inputs that separate a buyable deal from a dead one.
This content is for informational and educational purposes only and should not be construed as investment, legal, tax, or financial advice. Figures shown are illustrative estimates based on historical market and public data and assumptions that may not reflect actual results. Real estate investments involve risk, including possible loss of principal. Past performance does not guarantee future results. Investors should conduct their own due diligence and consult qualified advisors before making investment decisions.
Estimated gross yields shown are hypothetical illustrations derived from HUD Fair Market Rents and median list prices. They are not net returns and will vary with financing, vacancy, insurance, operating expenses, property condition, and execution.